On the 13th floor of a building in the middle of Manhattan, an eye surgeon wearing a head tracker steps inside a three-dimensional image of a patient’s retina projected onto the walls of a virtual-reality Cave. “We construct the 3D image from slices taken with an optical coherence tomography (OCT) scanner,” explains Luis Gracia, assistant imaging technology engineer at the Weill Cornell medical college. “[The surgeon] can find things by scrolling through the slices on his desktop, but the Cave is just two flights up the stairs from his office, and in the Cave, he can see everything in five seconds.”
Gracia, along with system administrator Vanessa Borcherding and assistant professor/technology engineer Jason Banfelder, has spent the past year and a half introducing surgeons, researchers, and others at the medical college to the advantages of interacting with data in immersive stereo 3D. The group works with the Department of Physiology and Biophysics, and the HRH Prince Alwaleed Bin Talal Bin Abdulaziz Alsaud Institute for Computational Biomedicine at the Weill Cornell medical college; the CAVE facility is part of the David A. Cofrin Center for Biomedical Information.
“In the beginning, people almost didn’t believe it,” Borcherding says. “We really had to grab them by the wrist and say, ‘You have to see this. It is as cool as we say.’ When they saw it, they appreciated and understood what it gave them.”
The Ophthalmology Department within the medical college was among the first to benefit. “They were looking at certain diseases that produce tiny, cystic spaces in the retina,” Banfelder says. “In the slices, they look like clumps of four or five together. But in 3D and in stereo, it becomes apparent that it is often one single body with tubular connections between the clumps; one contiguous space that is convex here and concave there. That wasn’t known or appreciated before.”
A stroke of luck provided the impetus for the Cave: A donation from Dr. David A. Cofrin specifically earmarked for a Cave. “He wanted to give one to the school,” Banfelder says. “I think he saw one and thought it was cool.”
Knowing that funding would be in place, Banfelder took a road trip to look at how people in various industries used Caves, and to learn about the various vendors. Eventually, the team chose Christie Digital Systems (see “Building a Cave”), which provided a turnkey solution.
Smoke and Mirrors
Because real estate in downtown Manhattan is precious, the room designated for the Cave was only 30 by 40 feet. To compensate for the small space, Christie used eight optically perfect mirrors to bend the light paths to the projectors so they didn’t need to be as far away from the screen as usual. “They had to engineer the system very tightly,” Banfelder says. “Also, it was the first Cave to use HD projectors and the first time they had built a structure out of fiberglass rather than aluminum. It’s fireproof, and strong, and cheaper. It was a risk on our part, but Christie was confident and willing to back it up.”
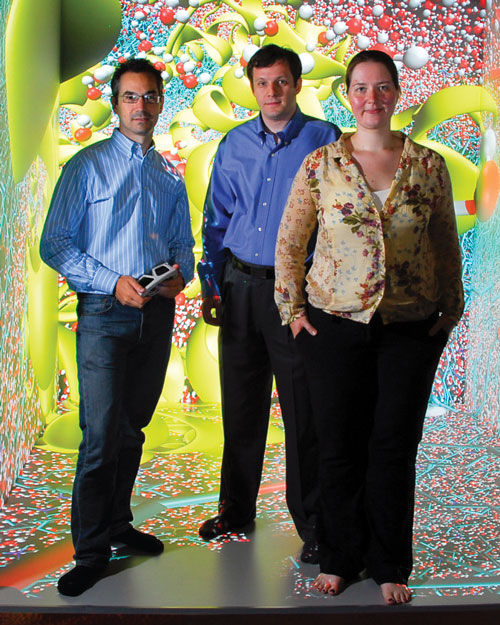
Luis Gracia, Jason Banfelder, and Vanessa Borcherding stand inside the VR Cave they helped design and now support for surgeons and biomedical researchers at the Weill Cornell Medical Center.
Images courtesy Luis Gracia.
It took nine months for Christie to design and build the system and three months to construct the physical environment. Now, Christie’s Mirage HD3 DLP projectors send images to three 8x8-foot walls and the floor. Two projectors per surface produce 1920x1080-resolution images that Christie’s software edge-blends and warps to produce an effective resolution of 1920x1920. Dell workstations equipped with Nvidia Quadro FX 4600s produce the images.
“We had to get the physical alignment right for the projectors, but the software inside does the geometry correction,” Borcherding says. “It was quite a project figuring out the graphic outputs, frame locking, software, configurations, laying out the three-space correctly, getting the calibration. Christies provided the turnkey solution, but we were very involved.”
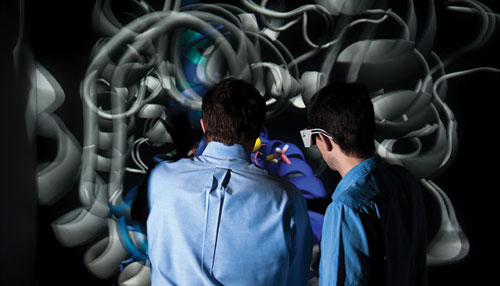
Inside the Cave, a user wearing a head tracker mounted on a pair of InterSense glasses moves the stereo 3D images surrounding him or her by changing position or with a six-degree-of-freedom wand. Other people in the Cave, all wearing shutter glasses, see what the “driver” sees.
“There is definitely a learning curve [for the users],” Borcherding says. “But it’s an intuitive interface. You can move around and see objects drawn from a new perspective. Or, you can just turn your head.”
Banfelder adds, “It takes people about 15 minutes to get oriented. After one or two sessions, they don’t need any help.”
Gracia joins in: “They get confident after a couple of hours. They quickly learn that if they want to turn things around, they can move themselves around the object.”
When the team first introduced the Cave to people at the medical college, they assumed that radiologists would be the ones most interested. “They were the least interested,” Borcherding points out. “They already had the 3D model in their heads.” Instead, the large 3D images inside the Cave were more interesting to surgeons and others who hadn’t spent years mentally visualizing the models.
The first project the team worked on was for a graduate student who was studying zebra fish. “He had found a publically available dataset of an optical scan of a zebrafish that we rendered,” Borcherding says. “We also rendered images from his lab of zebrafish that had been injected with calcium imaging dyes to study patterns of neuronal activity.”
Researchers have learned they can more easily share the 3D models they’ve visualized in their minds with their students by immersing the students within large, stereo 3D reconstructions inside the Cave.
The team displayed the stereo 3D images on the walls of the Cave. “When he brought in the rest of the lab,” Borcherding continues, “they said things like, ‘I can see how the hindbrain connects now.’ They understood how things were connected; they could see the big picture and the fine details.”
Adds Banfelder, “They said they wished they had the Cave when they were trying to learn anatomy in the first place. They wouldn’t have had to build a mental model; it was right in front of them.”
Now, the surgeons and researchers typically use the Cave to look at data in three broad categories. The first involves data from various types of body scans, MRIs, OCTs, and confocal microscopsy, which, in the Cave, become voxel-based images. A second category includes x, y, and z coordinates of atoms and the bonds that connect them for displaying molecular simulations of proteins and the small molecules they interact with, particularly lipid membrane-bound proteins involved in cell signalings. The third category includes abstract datasets, that is, networks showing gene interactions. “The databases come from a variety of experiments,” Banfelder says. “When we render these networks, we don’t have physical backing for the x, y, z coordinates. We lay out the network to make it attractive and informative.”
To produce the images, the team uses three programs. Avizo from the Visualization Sciences Group for the voxel-based images based on MRI scans, confocal microscopsy, and OCT. “We also use Avizo for vector data,” Banfelder says. “In collaboration with the Cooper Union, a local engineering school, we’ve visualized airflow in the nose and throat. It’s like airflow over a wing, but it’s inside the nose. We use it for 3D fields like that.”
For molecular visualization, the team draws on the public-domain software Visual Molecular Dynamics (VMD), supported by the Theoretical and Computational Biophysics Group, an NIH Resource for Macromolecular Modeling and Bioinformatics at the Beckman Institute, University of Illinois at Urbana-Champaign. “It’s software that many researchers use,” Gracia says, “so it’s very convenient.”
Building a Cave
Doug Boyer, sales manager with Christie’s Visual Environments team, had been working with Cornell University in New York when he heard that the Cornell medical college was interested in a VR Cave. “I was the last vendor on board,” he says. Before long, he was directly involved in installing that Cave.
The biggest challenge for the installation was the small room. “Originally, we proposed a 96x96-inch viewable screen for the three walls and floor,” Boyer says. “After doing the site survey and carrying a physical mock-up through the building, we determined that the largest screens could be 93x93 inches. For the screens, Christie had acrylic surfaces manufactured with a special diffusion coating.
Although some vendors suggested installing four to eight LED projectors on the front wall and four on the sides, the solution Christie devised used two, three-chip DLP projectors with Xenon lamps for each of the three walls and the floor—a total of eight Mirage HD3 projectors.
“At the time of the [Cornell] installation, we were the first to market with native HD DLP projectors,” Boyer says. “Each projector had 1920x1080 resolution; we edge-blend to create an overall 1920x1920 resolution; the projectors have edge-blending and image-warping capability built in.”
The projectors display the images in active stereo. “They take in 60Hz, line double, and display 120Hz,” Boyer says. “The user wears shutter glasses that flicker at 60 frames per second per eye.”
Helping make edge blending possible was Christie’s wide range of lens sizes for the projector. “You have to find a balance when you’re doing edge blending,” Boyer says. “You don’t want a short throw. We had to take into account the throw distance and the quality the image would have. To shorten the throw distance, we used mirrors that bounce the projected light off the screen; we actually bend the light using these glass mirrors.”
Inside the Cave, a motion-tracking system captures the user’s eye movement via a wireless device mounted on the 3D glasses, and receives input from an interaction device—a handheld wand with multiple buttons. “It tracks the head and the wand simultaneously,” Boyer says. People inside the virtual environment see the perspective view from the person with the head tracker and wand. In addition, the system includes surround sound.
Once Christie received all the parts in the company’s Ontario office, the installation team built the entire environment there before taking it on the road. “We built it in Kitchener [Ontario], then tore it down, shipped it to New York, and assembled it there,” Boyer says. “Now, we go back twice a year to replace lamps and filters, dust off the mirrors, do color balancing, and tweak the tracking as needed. –Barbara Robertson
|
Lastly, the group writes proprietary software. “For the general network visualization, we’ve been writing our own code based on Vrui VR Toolkit, a framework developed for immersive applications by Oliver Kreylos at UC Davis,” Banfelder says. “It’s not well known, but it works well. We write OpenGL code, and it renders across all the projectors. It doesn’t care whether the user has a mouse or a 3D wand; it just makes it all work.”
Discoveries
Many researchers have now joined the ophthalmologist in making discoveries inside the Cave, sometimes to their surprise. Gracia and Banfelder tell one story:
Gracia: “The researcher was working on integrins, which are proteins that are so huge they’re difficult to see even with a big monitor and in 3D. There are so many atoms, it’s hard to see every detail. He had been looking at this protein in every direction for years.”
Banfelder: “We were amused because he was a little skeptical. He had a 3D printout of the protein, a little 3D model he had made with stereolithography that he held in his hand. In the Cave, the model was so much bigger. He could change the colors, look at everything close to one part. He had flexibility.”
Gracia: “I don’t remember his exact words, but he said something like, ‘I’ve never seen it from this angle.’ He could see something in there, some interaction that he had not seen before.”
Alongside the researcher in the room were several students, all discussing the structure of the protein. The researcher wore the tracker and moved the wand. “He had been working on the structure before some of us on this team were born,” Banfelder says. “So, he probably had a good model of it in his head. But he could save the students in his lab months of time understanding the model.”
Researchers also draw on the Cave to look at time-lapse photography at a molecular level using data from confocal microscopes. “The field of view is maybe 10 cells,” Banfelder says. “We can take the slices and create 3D models of the cells. The scientists can see the mechanisms of individual molecules distributed spatially within the cells.”


Surgeons can move intuitively inside the large voxel-based images using a wand or by moving their heads. Inside the Cave, they can quickly see elements difficult to visualize from slices produced by medical scanners, and sometimes discover relationships impossible to determine from the slices.
Banfelder estimates that the team so far has worked with researchers in approximately a dozen labs out of the hundreds at the university, but the pace is quickening. “It took a lot of time to work with people at the beginning,” Gracia says. “We had to convince people, but now they’re starting to come to us for help.”
Also, the first application of an OCT scan, the project for the ophthalmologist, took the team several months to render inside the Cave. “Now, we can do it in five minutes,” Banfelder says. “Each project goes along those lines. Every time we do one, we get better.”
Next Steps
As more people discover the advantages of seeing their data in the Cave, it’s likely there will be more requests than time allows. “We don’t have money or space for a second Cave,” Banfelder says. “So, one of our main criteria for the software is that it can run in stereo on the desktop so we can push the visuals out of the Cave.”
They hope that the success of this project will inspire other medical colleges to consider this type of visualization. “Our installation was in the seven figures,” Banfelder says. “So it’s not something a single lab would ever buy. But, they could install a high-end visualization wall and get 80 percent of the benefit for 20 percent of the cost.”
Even with only one visualization wall, as Borcherding points out, “someone could bring in everyone in the lab and show them what they’re working on: the model in their head.”
This, they expect, will become increasingly important, as will Caves such as the one they have installed. Banfelder notes that today’s instruments generate more data than people have the capability to look at. “There’s so much data, especially in bioinformatics, that people do one analysis and then put the data on the shelf. But the Cave can give them a way to visualize massive amounts of data very quickly and detect patterns in data that weren’t anticipated.”
In fact, Banfelder hopes the Cave will help inspire the manufacturers to provide more data—that is, higher-resolution images. “Five years ago, for many imaging modalities, the resolution wasn’t available for good 3D reconstructions,” he says. “Now we’re seeing that. And when we have better visualizations, they have more incentive to capture the data.”
“When we told the manufacturers what resolution we wanted,” Banfelder continues, “they said, ‘What would you do with that?’ When they see the Cave, they know. We want to inspire them to improve the resolution, to go as high as they can, to get finer slices, less distance between the cut plates.”
In addition to encouraging other labs to create high-end visualization systems, the team has entered into conversations with manufacturers and drug companies that might provide the same types of visual representations. “We’re starting to talk to instrument manufacturers,” Banfelder says. “In the OCT world, for example, everyone looks at slices, and there has been no access to true 3D reconstructions for the average physician who has one of these scanners. We are talking to manufacturers about rendering these reconstructions on a computer attached to a scanner so it could become a standard of care.”
Someday, thanks to the inspiring work from this team, we might see that ophthalmology surgeon wearing the head tracker in his own office, rather than jogging up two flights of stairs.
Barbara Robertson is an award-winning writer and a contributing editor for Computer Graphics World. She can be reached at BarbaraRR@comcast.net.